Start here
What Dimension Labs does
Dimension Labs is the analytics agent for customer language. What it does with your data, what makes it different, and the meaning layer underneath.
Every conversation, review and survey holds critical, high-context information. Dimension Labs reads all of them, turns each one into dozens of measurable dimensions, and blends them with your revenue and operational data. The result is a true omni-channel picture that shows what to act on and measures the impact as you go.
From question to moved metric
Section titled “From question to moved metric”- 01 Ask
Start with the question you actually have. Plain English, no query to write.
Read more › - 02 Blend
Every channel, joined to your business data: tickets, calls, chats, reviews and surveys next to revenue, renewals, orders and usage.
Read more › - 03 Enrich
Every conversation is read in full and written back as typed fields we call Dimensions. Language has more axes than sentiment.
Read more › - 04 Prove
Drivers ranked by effect, not volume. Dashboards rank what's loud. Causal analysis finds what's costly.
Read more › - 05 Act and measure
One omni-channel picture: find the action that moves the metric, then measure it as new data arrives.
Read more › - 06 Deliver
Any output you need, kept up to date: charts, reports, decks, dashboards, alerts.
Read more ›
What makes it different
Section titled “What makes it different”Most analytics tells you what happened. The hard question is why, and the expensive gap in most companies is the distance between the two.
Analytics is usually described in four tiers:
| Tier | The question it answers | Usually answered with |
|---|---|---|
| Descriptive | What happened? | Dashboards and BI |
| Diagnostic | Where and when did it change? | BI analysis |
| Predictive | What will happen? | Machine learning models |
| Causal | Why did it happen? | Dimension Labs |
The first three tiers need structured inputs: tables, columns, numeric fields. What customers actually say, ask and complain about is invisible to them. Dimension Labs joins that language (calls, chats, tickets, reviews, surveys, transcripts) to your structured business metrics, and tests which signals actually move the metric. The answer comes back with the numbers behind it and the conversations that explain it.
The meaning layer
Section titled “The meaning layer”The meaning layer is what sits between your raw data and the agent. It is one schema that holds three things together:
| Part | What it holds |
|---|---|
| Original conversations | Every conversation from every channel you’ve connected, kept as the original text. |
| Dimensions, per conversation | Each conversation enriched into structured fields: topic, sentiment, intent, effort, root cause, and any custom signal your team defines. Per conversation, not per cohort. |
| Business data | Your structured data next to it: CRM, billing, product usage, agent metrics, campaigns. |
Because language and metrics live in the same place, you can query them together like any column in a warehouse. Drill from a number to the conversations behind it. Filter transcripts by revenue cohort. Compare sentiment with churn, conversation by conversation.
What happens inside it
Section titled “What happens inside it”- Enrich. Each conversation is read in full and written back as Dimensions. A live integration is enriched automatically every day. A file upload, and anything sent to
/trackhistorical, needs a backfill, which you start from the Backfill tab. The standard Dimensions run every day only when Dimension Labs turns on daily enrichment for your workspace (ask [email protected]); otherwise, run a backfill. See When enrichment runs. - Join. Enriched conversations are joined to your business data on shared identifiers, such as an account id or order id. The agent works out the join from the overlapping fields. See Join business data.
- Prove. Once language and metrics share a schema, the agent can run statistical tests, control for other differences between customers, and report effect sizes and confidence intervals instead of keyword counts. See How we prove a driver.
- Repeat. Saved analysis plans run again on fresh data, so the prompts you design and the analyses you save keep paying off. See Analysis plans.
Why structure first
Section titled “Why structure first”Labels on their own aren’t the point. Fixing each conversation’s Dimensions in a table gives every later analysis the same starting point, a ground truth:
- Repeatable. Different people, on different days, get the same counts from the same data.
- Checkable. Every label sits next to the conversation it came from, and a companion verbatim Dimension can quote the customer’s exact words.
- Quantifiable. Typed fields can be counted, averaged and tested, so findings come with numbers that support a decision.
This is also the answer to “can we trust AI-generated results?”: the analysis builds on stored, inspectable labels, not on a model rereading the text differently each time. For how consistent those labels are, see How reliable the labels are.
How it fits with your existing stack
Section titled “How it fits with your existing stack”The meaning layer is additive. It doesn’t replace your warehouse, your BI tool or your ML pipelines. Your Dimensions are yours. To get them into your own systems, including Snowflake, BigQuery or Databricks, pull them with the Export API: it returns a zip file of all enrichments by day, filtered by integration ID and date range, using a key from Settings. The agent is one user of the layer; your team and your downstream systems are others.
Questions it makes possible
Section titled “Questions it makes possible”Each of these needs language and metrics joined. None of them can be answered from a warehouse alone, a BI tool alone, or an AI batch job alone.
- “What’s driving churn in mid-market but not enterprise?”
- “Which conversation themes predict expansion 90 days out?”
- “What’s the revenue impact of fixing this product issue?”
- “Which agent behaviors come before retention, and which before churn?”
- “Why did NPS drop last quarter, and which segment is responsible?”
- “Which feedback themes go with renewals across the last four cohorts?”
Working with the agent
Section titled “Working with the agent”You reach all of this through the agent, in plain English. Four ways people use it:
- Ask a question. “What’s driving churn in mid-market last quarter?” The agent writes the SQL, queries across conversation and business data, and returns an answer backed by evidence. Ask for the conversations behind any number.
- Make a chart. Ask for a metric, trend, segment or driver as a chart. The agent builds it and can give you the underlying rows.
- Work toward an objective. Give it a business objective, such as churn, expansion, conversion, retention, product demand or support quality. It writes an analysis plan, runs it, and reports the drivers, changes, themes and quotes tied to that objective.
- Produce a report. When the answer needs to go to leadership, the agent writes a report with an executive summary, the statistics, key findings, charts and source evidence. See Reports, decks and sharing.
What you work with
Section titled “What you work with”- Data Sources, where your data comes in. Conversations, reviews, surveys and tickets go under Unstructured data and get enriched. Revenue, orders, accounts and anything else in rows and columns go under Structured data as business data, which is queryable but never enriched. See Choose your path.
- Dimensions, the structured fields we extract from each conversation, such as the reason for contact, a predicted satisfaction score, or whether a customer mentioned a competitor. See What a Dimension is.
- The agent, which you talk to in plain English. It reads your tables, runs the queries and statistics, and builds the chart, report or deck. See What the agent does.
- Projects, which hold the files and standing instructions for a piece of work, so the agent starts every chat with the same context. See Projects and standing instructions.
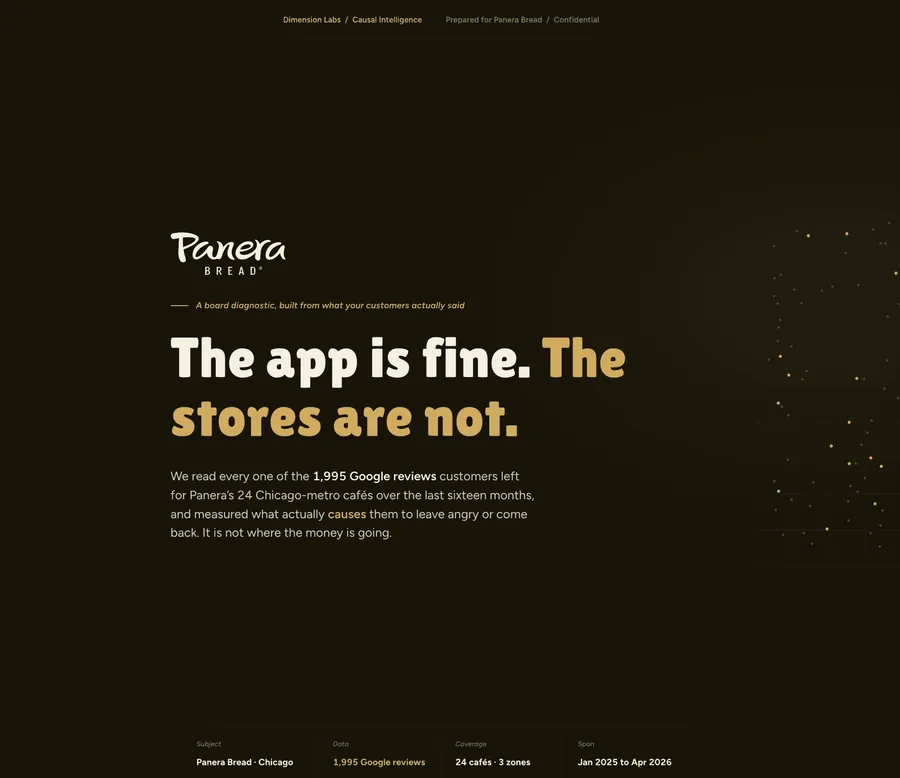 Store Performance Diagnostic Panera Bread
 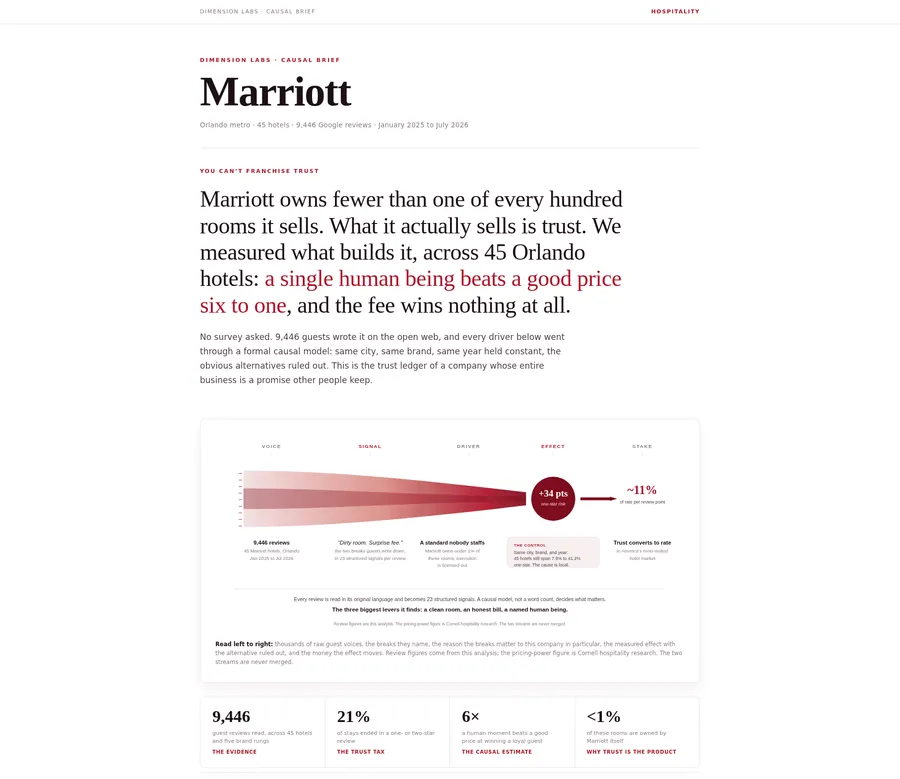 Multi-Location Review Analysis Marriott
 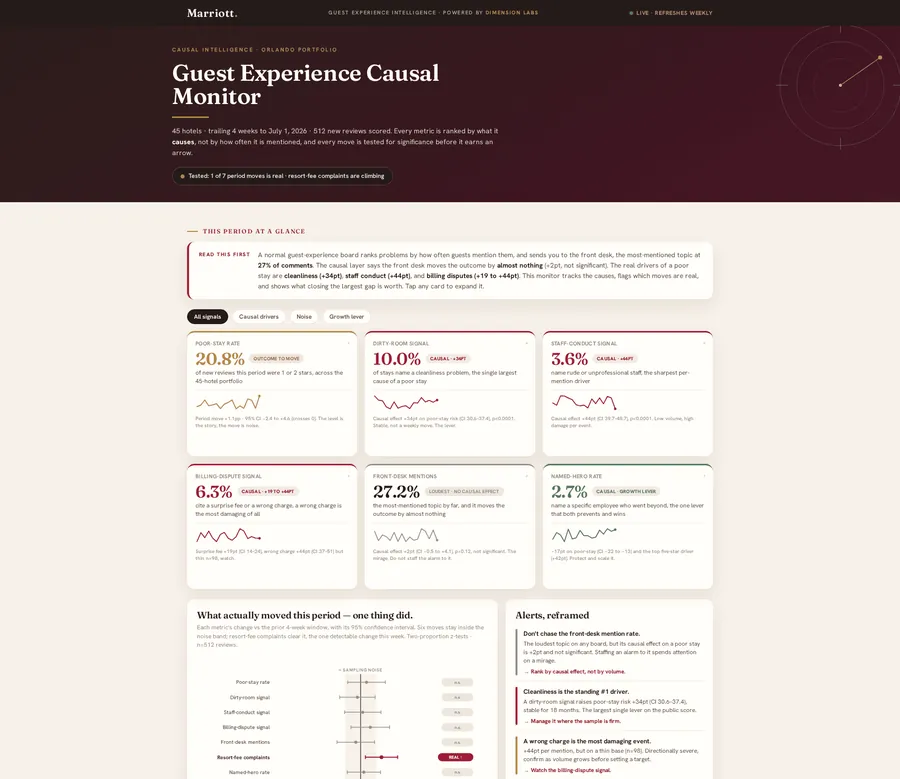 Guest Experience Monitor Marriott
 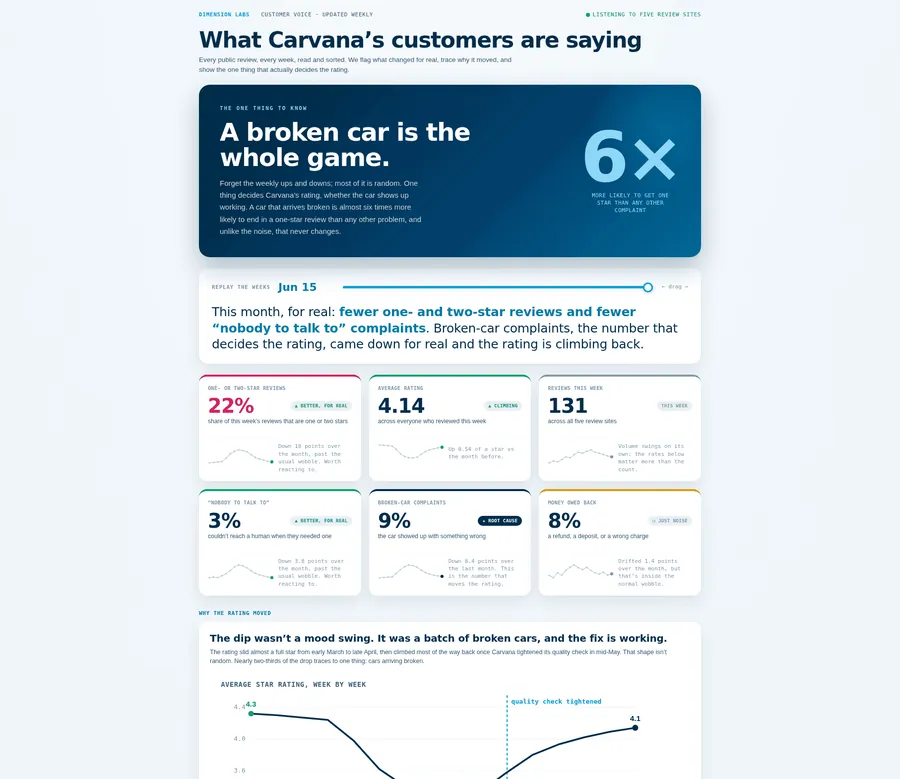 Customer Voice Monitor Carvana
 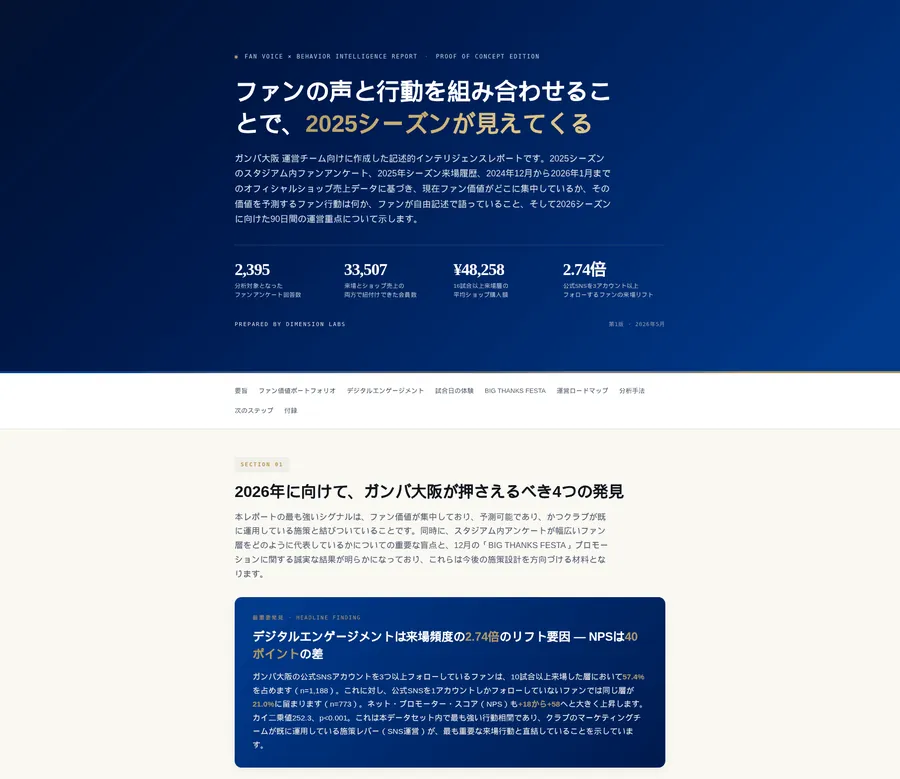 Fan Behavior Intelligence (Japanese) Gamba Osaka
 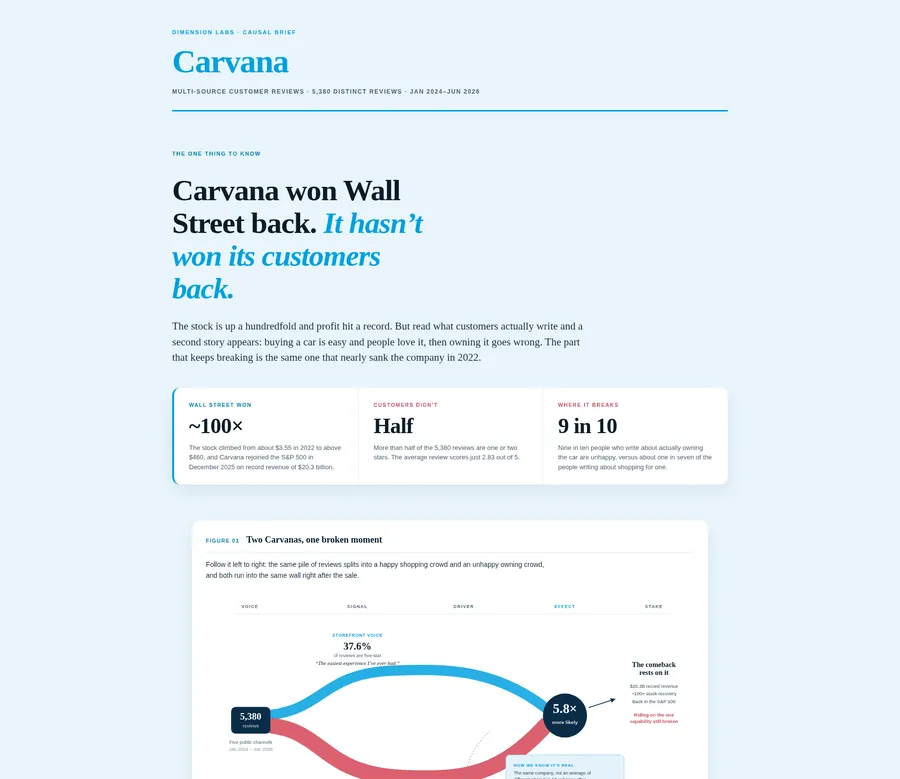 Multi-Source Review Analysis Carvana
 Where to go next
Section titled “Where to go next”- Quickstart: sign up and get a first answer.
- Choose your path: get your own data in.
- Check a file: catch format problems before you upload.