
Dashboards
Our fully customizable Dashboards provide a canvass for data visualizations and reporting.
Dashboards
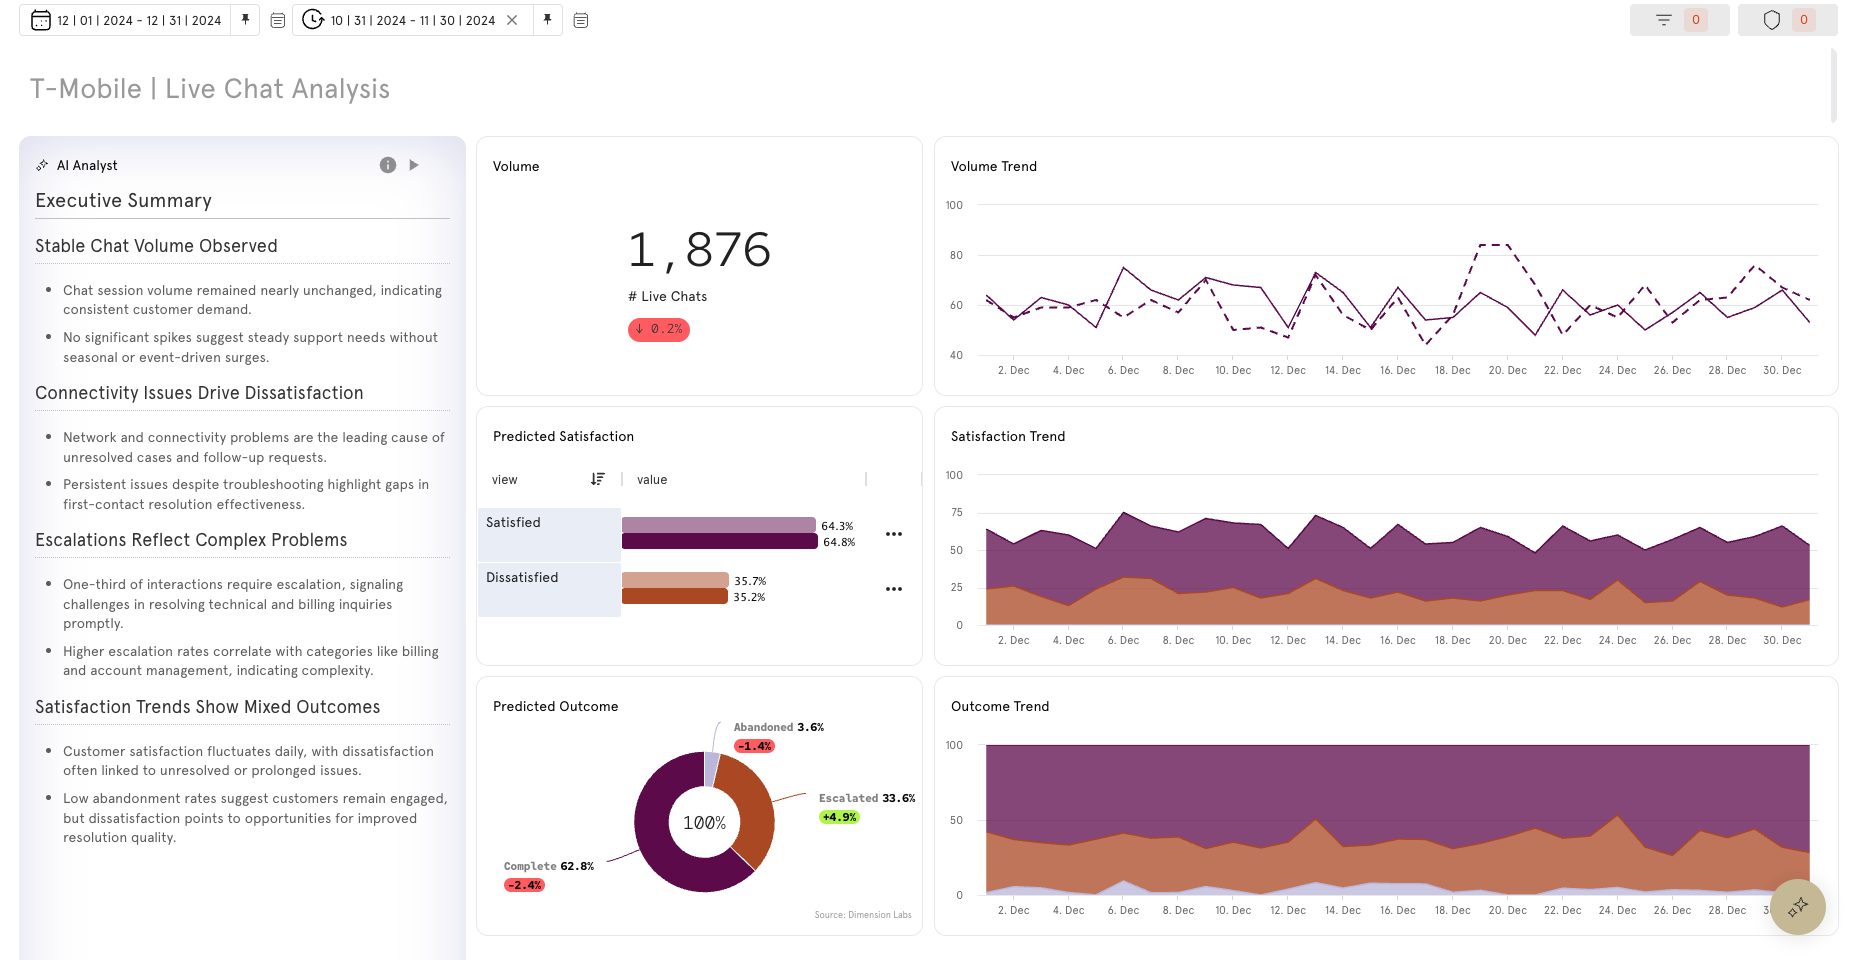
Visualize performance and track progress over time with dynamic, data-driven reporting. Dashboards centralize saved visualizations from across the platform—Mapped categories and themes, Data Explorer insights, Flow analytics, and other modules—into a single, configurable view. Each dashboard card updates automatically, enabling continuous monitoring of KPIs, customer journeys, and categories critical to your business.
Use this module to real-time view of your data with both high-level overviews and the ability to drill down into cards. Customize filters, layouts, and visual combinations to include the metrics that matter most to your team.
- Automatically updates with the latest data for always-on visibility.
- Combines multiple data sources into one cohesive reporting layer.
- Fully configurable filters, layouts, and shareable links for tracking.
Dashboard Quickstart Guide
Need insights fast? Get an instant win using the platform’s auto-mapping capabilities.
Use Case: Contact Reason Analysis
The "Reason" dimension identifies the primary motivation behind each customer contact, assigning dynamic labels to each conversation. These labels can be grouped into Category Clusters. With the Dashboard module users can visualize how these categories relate, create reports and monitor changes over time.
- Create with a library of fully customizable cards.
- Track how metrics and categories change over time.
- Use AI Analyst cards to identify key trends fast.
Dashboard Quickstart: Contact Reason Analysis [4:52] (no sound)
This quick start guide uses the Category Clusters from the Mapping Quickstart, but users may also use the Category | session dimension (a single theme per conversation) or create their own Categories using custom prompting in the Enrichment module.
Before Building Dashboards:
- Tips on building custom cards start with Data Explorer Quickstart Guide
- Tips on customizing categories start with Mapping Quickstart Guide
Updated 2 months ago