
Data Explorer
Data Explorer is a querying solution for reporting of your conversational data without any SQL or programming expertise.
Data Explorer
Visualize any aspect of your data. Your unstructured text data comes with columns of additional metadata and many more dimensions added using enrichment and mapping. But how can you easily navigate all this data?
Data Explorer offers a flexible analysis tool covering your entire dataset:
Using Data Explorer, you can break down reasons across channels, time periods, customer types, or any other attribute. And once you’ve identified the queries you care about, simply save them and convert them into persistent dashboard cards for ongoing monitoring.
- No-code interface to generate SQL queries for all dimensions and metadata.
- Add highly custom data visualization to Dashboards as cards.
- Formulas allow for calculating percentages and indexes.
Data Explorer Quickstart Guide
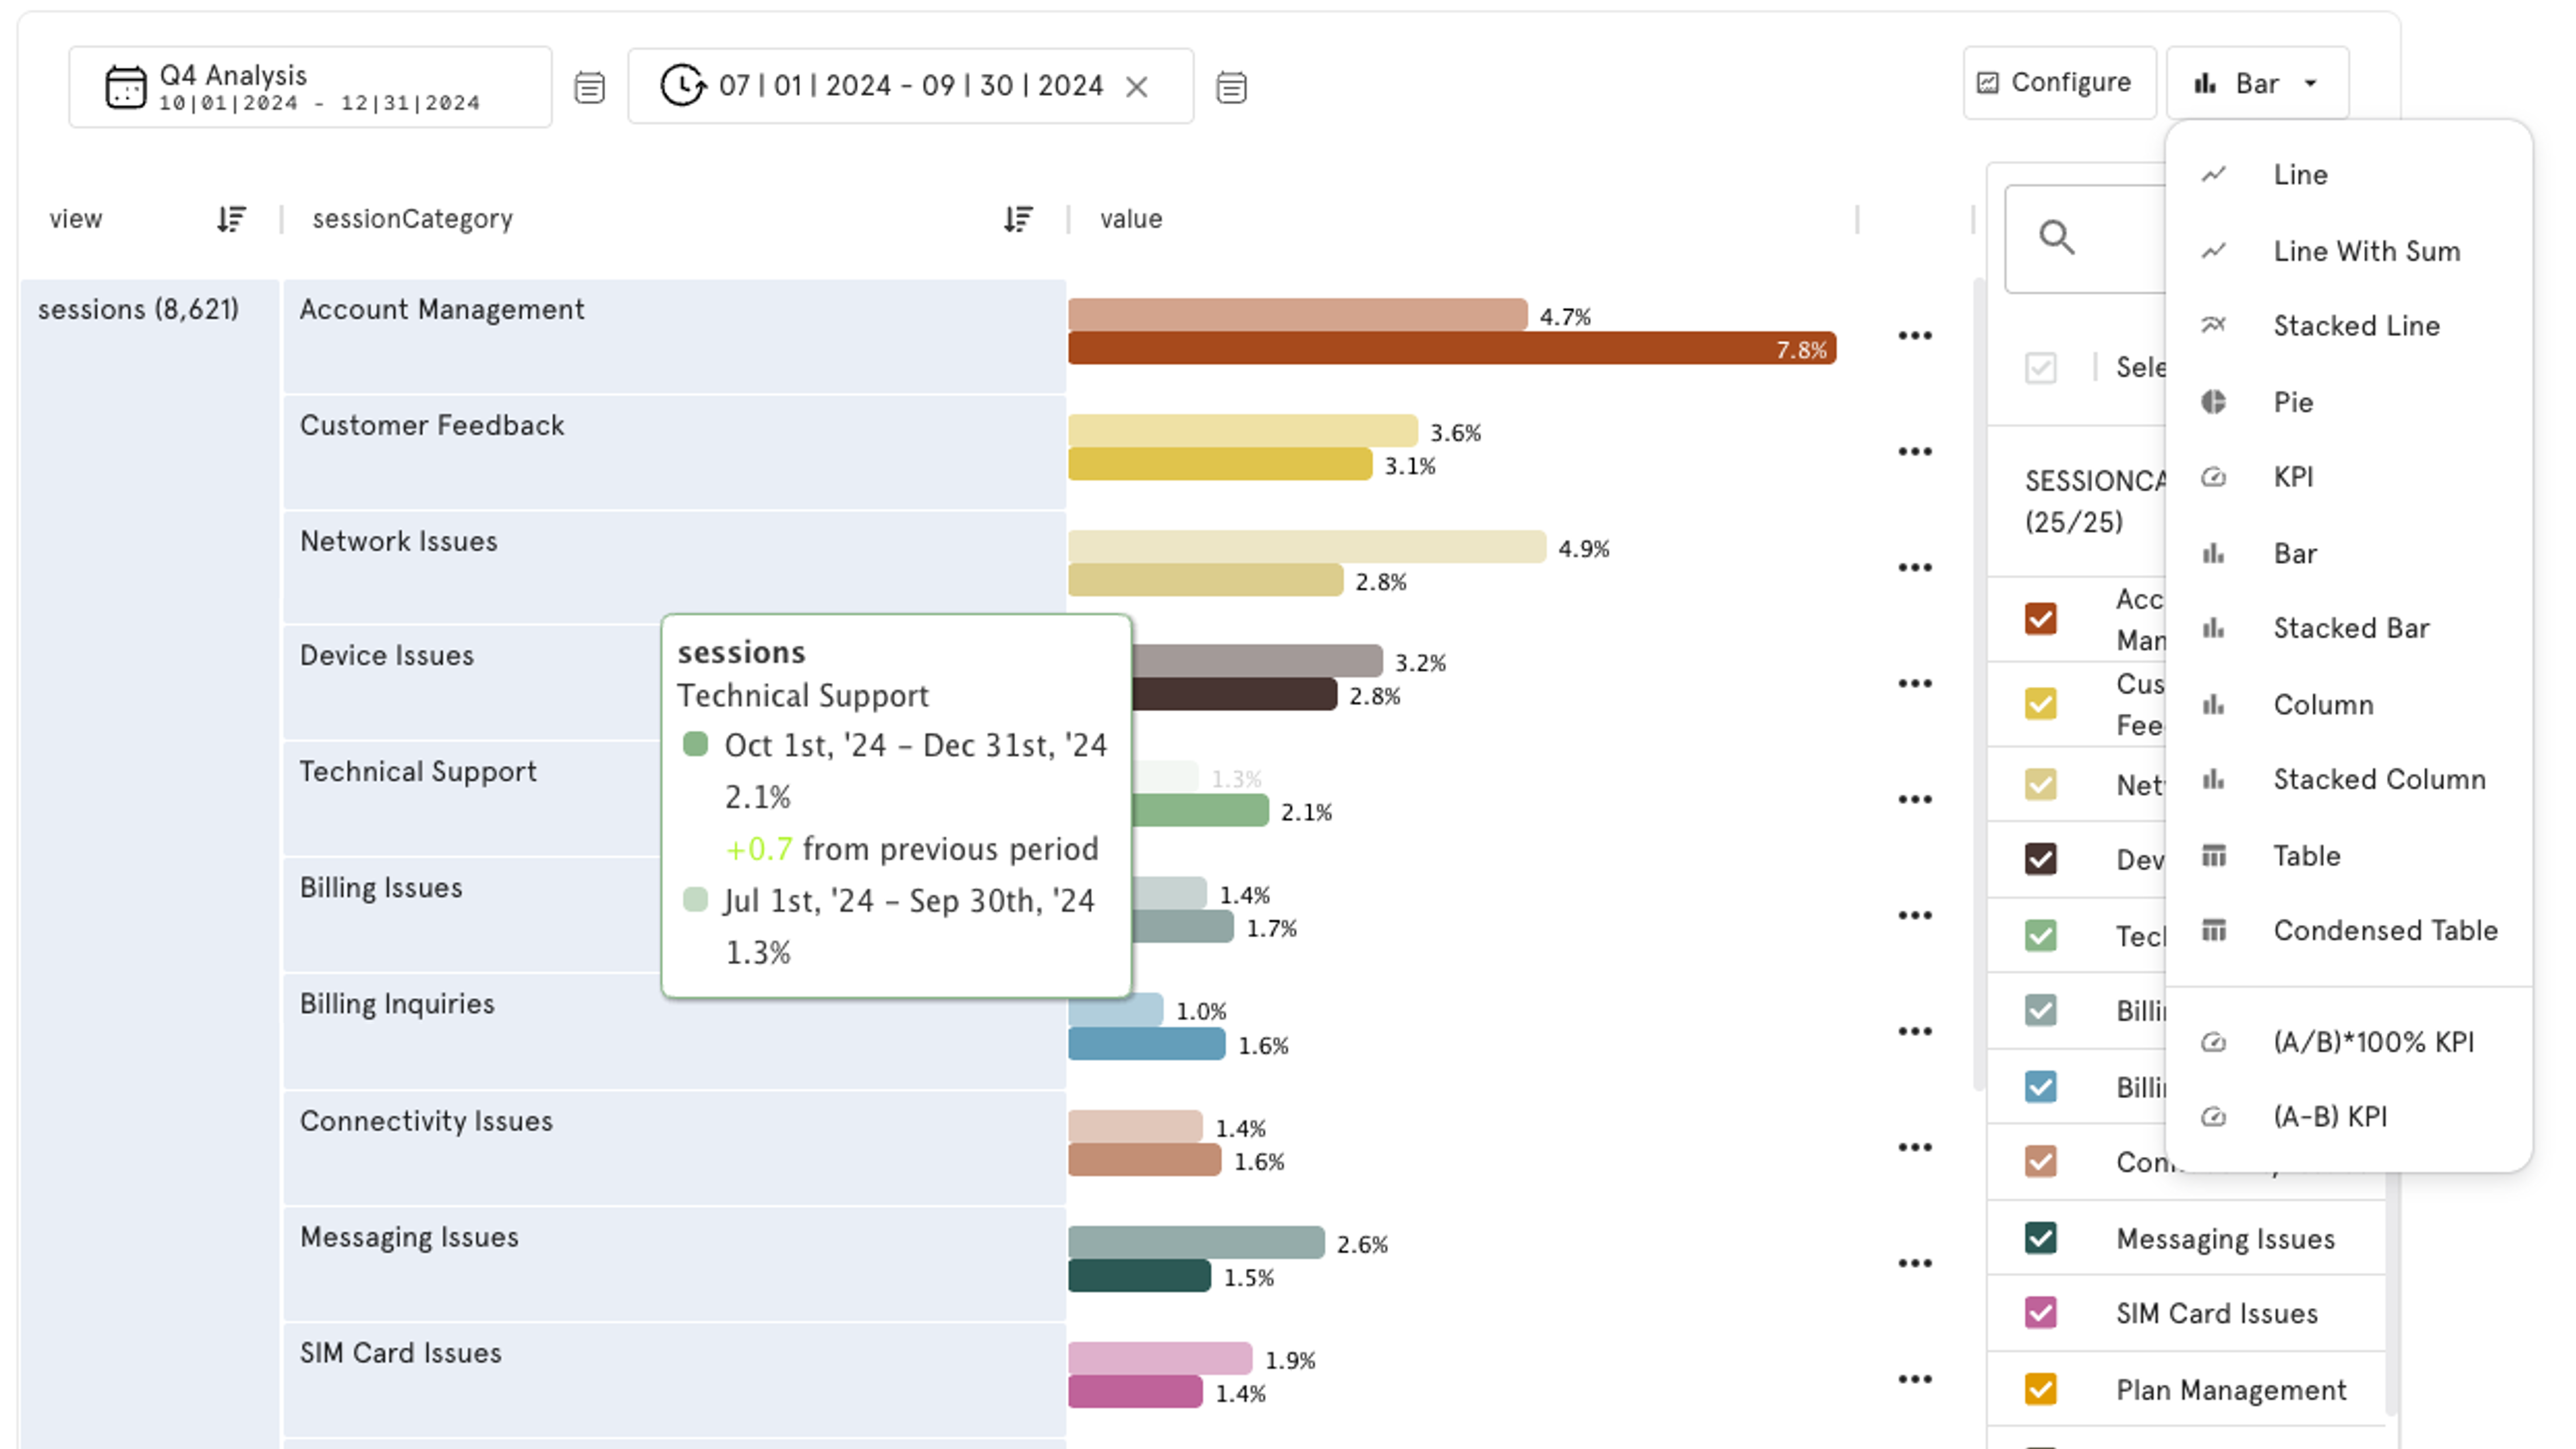
Need to drill into the data? Create a custom visual for any dimension.
Use Case: Negative Sentiment Drivers
Categories and Sentiment Clusters (Positive, Neutral, Negative) are both available as standard dimensions of analysis. Combine these outputs using Data Explorer to build out an analysis of your data.
- Create breakdowns across any dimension of analysis.
- Filter to target specific fields in the data.
- Identify trends over time.
Data Explorer Quickstart: Negative Sentiment Drivers [5:15]
11/2025
Data Explorer FAQ
Q: How to export data?
A: Export data to Excel or CSV for any data explorer card. Include SessionId in the breakdown to create tables with case-level data.
Updated about 2 months ago